

Confusion Matrix
A confusion matrix, also known as an error matrix, is a table layout of measurement results that allows visualization of the performance of an algorithm under various conditions.
A common confusion matrix used for machine learning measures actual known classes against predicted classes:
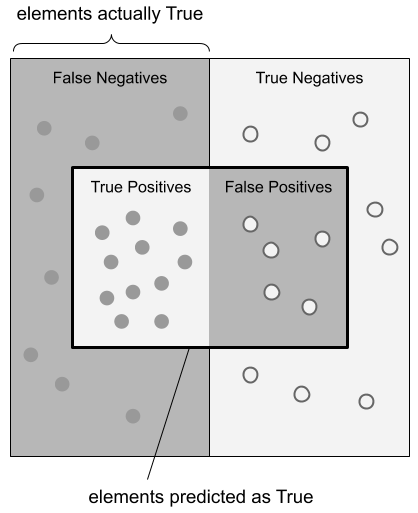
It is often useful to visualize the confusion matrix as illustrated below:
Derived Values
A confusion matrix can be used to derive a number of measures. See the table here.
Sensitivity/Recall
Sensitivity (aka: True Positive Rate, Recall, Hit Rate) is a measure of how many of the elements that should have been predicted as True actually were predicted as True.
Using a photograph image recognition example, if a model is trained to predict when a photo contains an automobile, sensitivity is what percent of all photos that do contain an automobile were predicted to contain an automobile.
Precision
Precision (aka: Positive Prediction Value) is a measure of how many of the elements that were predicted as True actually were True.
Using a photograph image recognition example, if a model is trained to predict when a photo contains an automobile, precision is what percent of photos that were predicted as containing an automobile actually did.
F1 Score
The F1 score is:
the harmonic mean of precision and recall
a weighted average of precision and recall
a measure of a test’s accuracy
a measure between 0 and 1
used in classification tests where True Negatives don’t matter much
calculated as:
Receiver Operating Characteristic (ROC)
Receiver Operating Characteristic (ROC):
is a graphical plot
measures diagnostic ability
works for binary classifier models (classifiers with two classes)
shows the True Positive Rate (TPR) against the False Positive Rate (FPR) for various threshold settings
was originally developed to test military radar receivers, thus giving it its name
Area Under ROC Curve (AUC)
is measured as the integral value of the area under the ROC curve
gives the probability that a classifier will rank a randomly chosen positive instance higher than a randomly chosen negative one
Other Metrics Derived from the Confusion Matrix
The table below comes from the Wikipedia article on the Confusion Matrix. See that article for the source references.
